+48 666 604 401 contact@fire-risk.eu
Thermographic inspection platform

From thermogram to finished report – in one platform

Thermographic inspections of PV systems, switchboards, buildings and battery energy storage – faster, following the standards, under your brand. AI proposes descriptions and priorities, you approve them, and your client gets a PDF report and their own portal.

Inspection modules

Five types of inspection in one platform

Drone PV inspections

  • RGB and radiometric IR orthomosaics, anomalies marked on the map or imported from QGIS (CSV)
  • AI analysis, classification against a pattern catalogue (CoA classes)
  • Repair priority from a type × ΔT matrix
Standards: IEC TS 62446-3

Electrical switchboards

  • AI groups images by switchboard and defines measurement areas
  • ΔT and repair priorities calculated from the measurement
  • The same anomaly recognised across several thermograms
Standards and guidelines: ISO 18434-1, VdS 2858

Buildings

  • Thermograms of façades and thermal bridges
  • Comparative assessment
  • AI-assisted descriptions, reviewed in the editor
Standards: EN ISO 6781-1, EN 13187

Inverters

  • Thermal images with temperature readings
  • Zones and AI-assisted review
  • Gallery in the client portal

Battery energy storage

  • Thermograms of battery modules, connections and power converters
  • AI-assisted descriptions, reviewed in the editor
  • PDF report and gallery in the client portal

Methodology based on standards and guidelines. Compliance of an inspection with a standard also depends on the operator’s qualifications, a proper measurement methodology and equipment that meets the technical requirements.

How it works

Three steps from images to report

You upload images and thermograms

RGB and IR orthomosaics from the flight, images from the thermal camera, an irradiance log. You mark anomalies on the map or import them from QGIS (CSV).

AI proposes, you approve

AI pre-detects and describes anomalies, and proposes classes and recommendations. The repair priority follows from the measurement (type × ΔT), and you check every proposal in the editor.

Your client gets a report and a portal

A PDF report under your company’s brand, plus a portal with an interactive map, an anomaly list and comments. A QR code shows whether a copy is up to date.
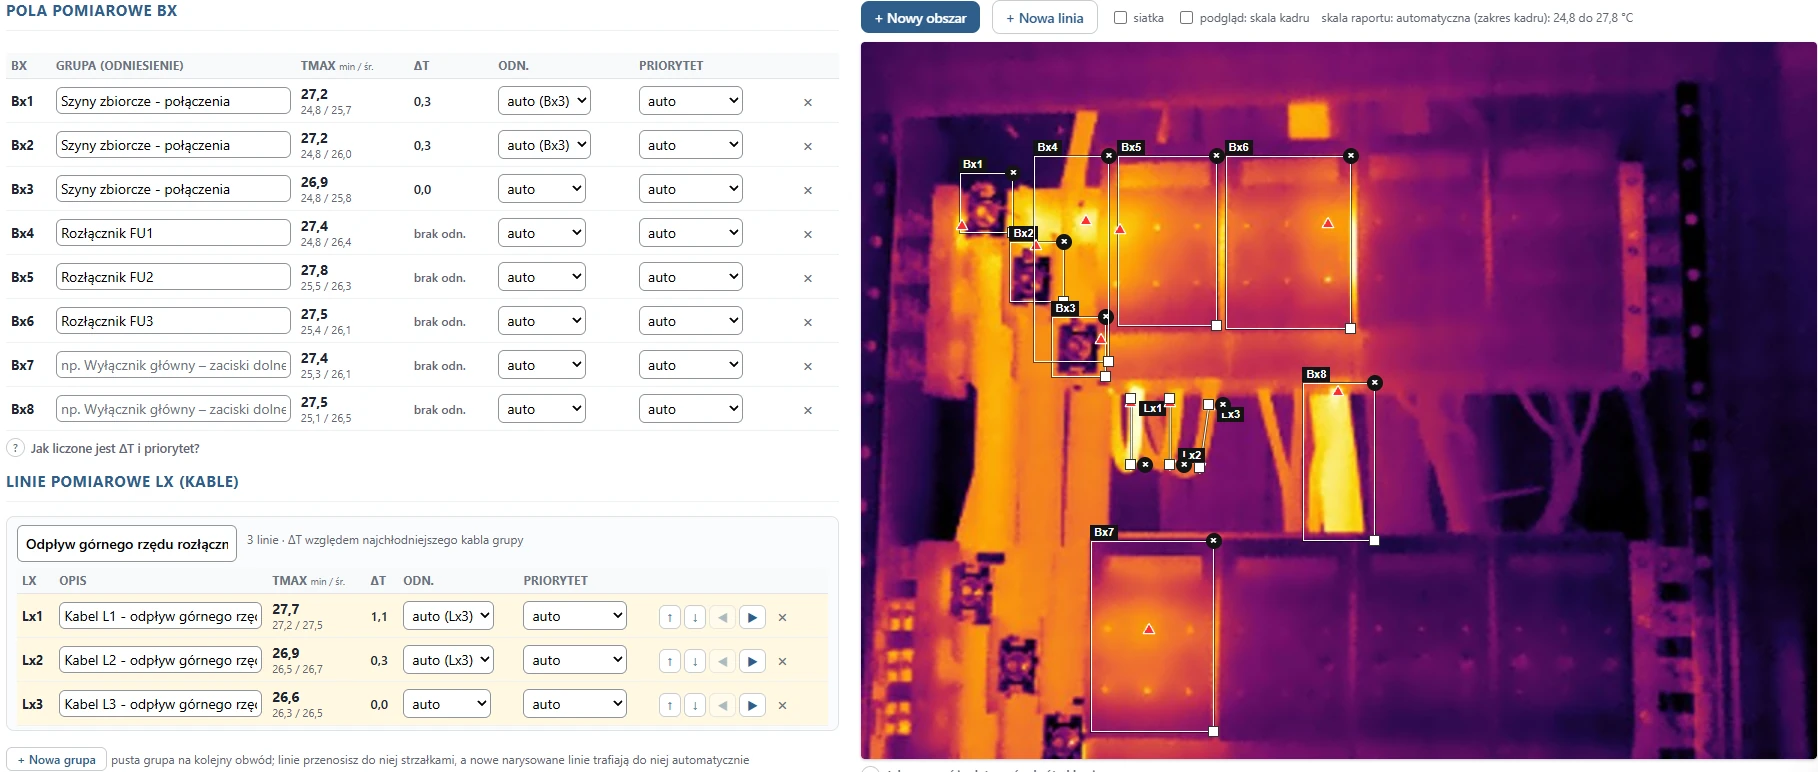
Switchboard thermogram editor: table of Bx measurement areas and Lx lines next to a thermogram with marked areas
Thermogram editor: Bx areas, Lx measurement lines on cables, a manual reference point, instructions for the AI written in plain language, version history.
Reports and standards

The report insurers expect

The PDF report under your company’s brand contains what insurers usually expect from thermographic inspections of electrical and PV installations.
  • Thermographer qualifications (ITC certificate) and details of the person approving the report
  • Measurement conditions: installation load, weather and, for PV, irradiance
  • Anomaly classification and repair priorities calculated from ΔT according to standards
  • Recommendations with deadlines for action
  • A thermogram and a visual image of every anomaly
  • Comparison with the previous inspection: fault fixed or getting worse
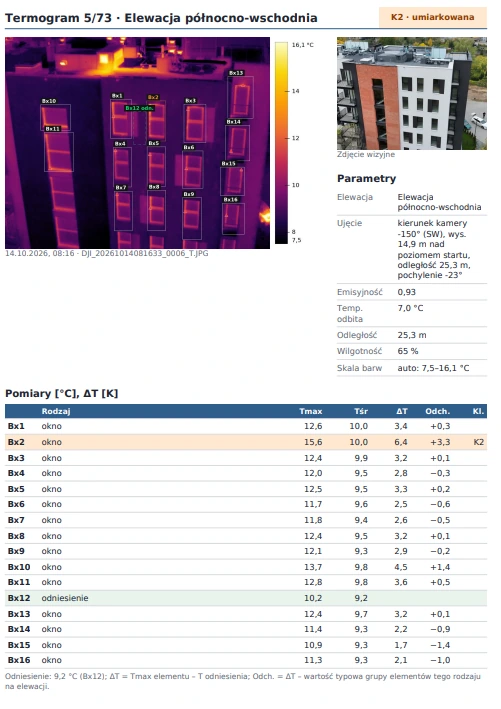
Page of a PDF building inspection report: façade thermogram, measurement parameters and ΔT table
Page of a building inspection report: thermogram, measurement parameters and ΔT table.

VdS 2858 guidelines

Inspection and reporting of electrical installations taking into account the VdS 2858 guidelines, widely used by insurers.

Up-to-date status via QR code

Every report has an issue number and a QR code. Scanning it shows whether a copy is up to date. The file of each issue never changes.

Periodic inspections

A calendar reminds you of the next inspection, e.g. the annual switchboard inspection required by an insurance policy.

Client portal

A portal for your clients

Your client logs in with an access code and has reports, an interactive map and inspection files in one place.
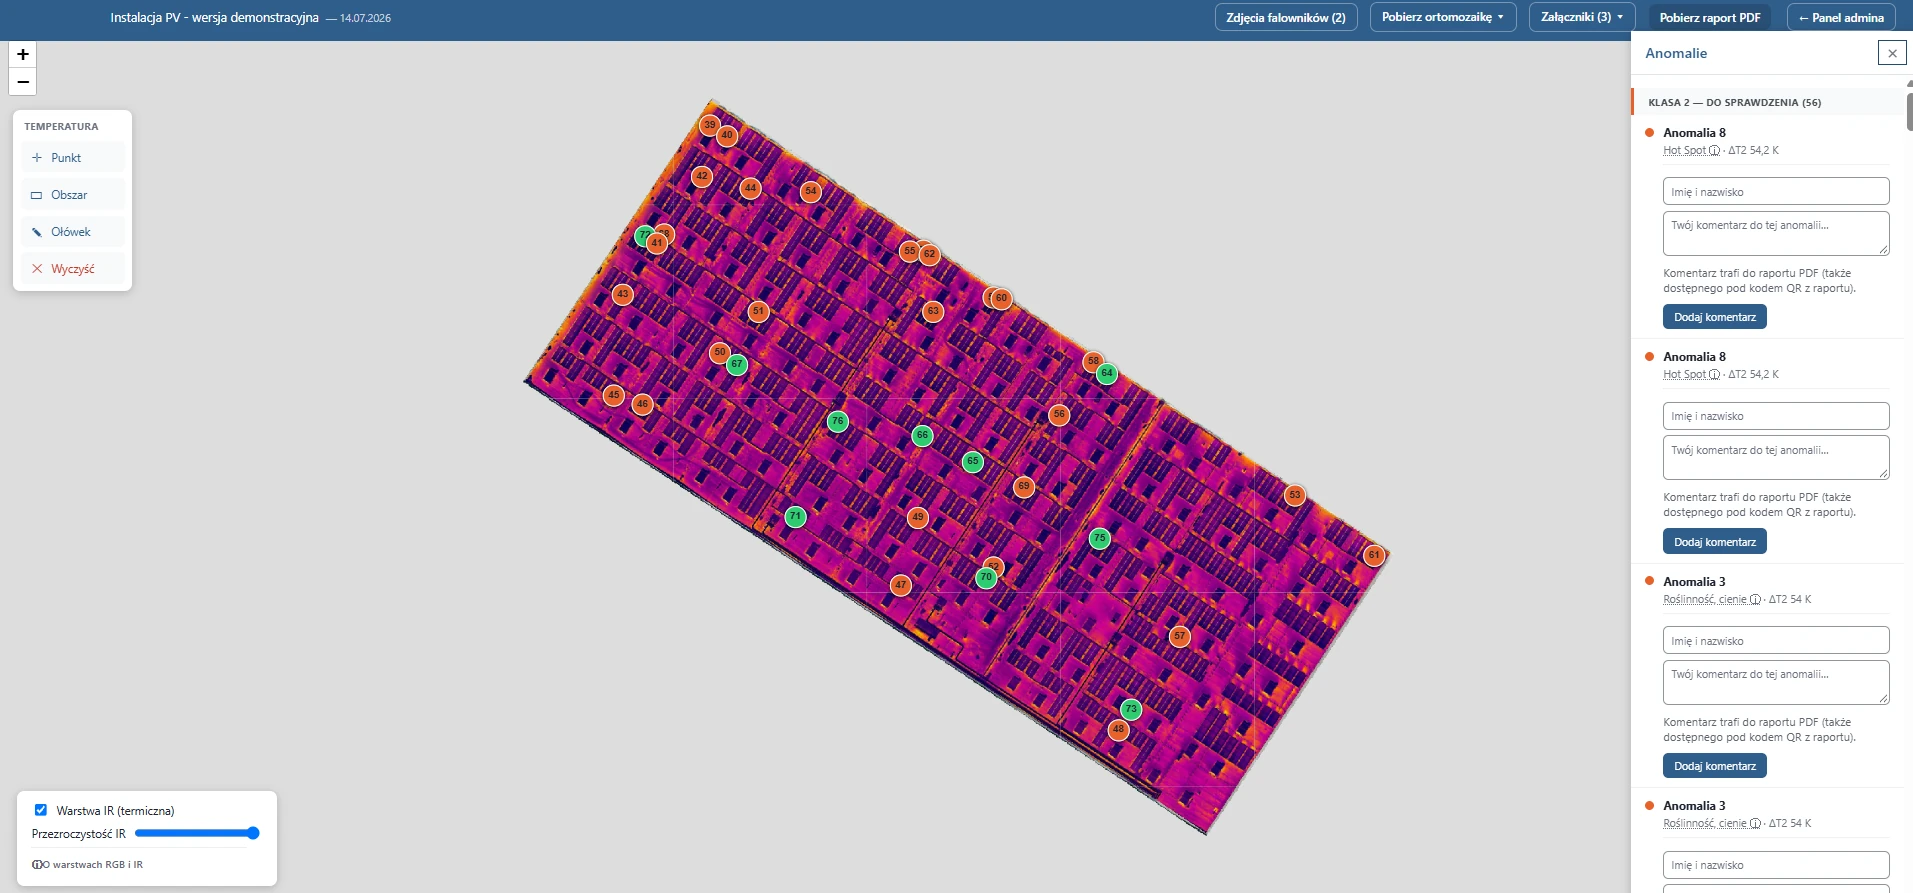
Client portal: thermal orthomosaic of a PV installation with numbered anomalies, temperature measurement tools and an anomaly list with a comment field

Access by code

A separate code for each project or a “master” code for all of a client’s reports. Access can expire on a set date.

Interactive map

An orthomosaic with temperature measurement: point, area, “pencil”, magnifier. Plus an anomaly list, PDF reports and files to download.

Client comments

Your client comments on the report in the portal. Their remarks go into the next issue.

Report by e-mail

The report and attachments, e.g. an invoice, in a well-designed template. You are notified when your client opens the link.

Optional service

No certified thermographer on your team?

The report can be prepared or reviewed by an engineer certified to ITC Level 1 (Category 1 Thermographer) who is also a fire safety engineer. Your clients receive a report signed by a certified specialist.

Ask for a quote
  1. You carry out the measurements on site and upload the data to the platform.
  2. The engineer analyses the thermograms, classifies anomalies and writes the recommendations.
  3. The engineer approves the report with their signature.
Contact

Book a demo of the platform

Write to us or give us a call. We will answer your questions and arrange a time for the demo.

Phone number
+48 666 604 401
Company details
FORFIBER SP. Z O.O.
VAT ID
PL7252219546

Have a question? Write to us